Search Ohio Property Record By Region

Search
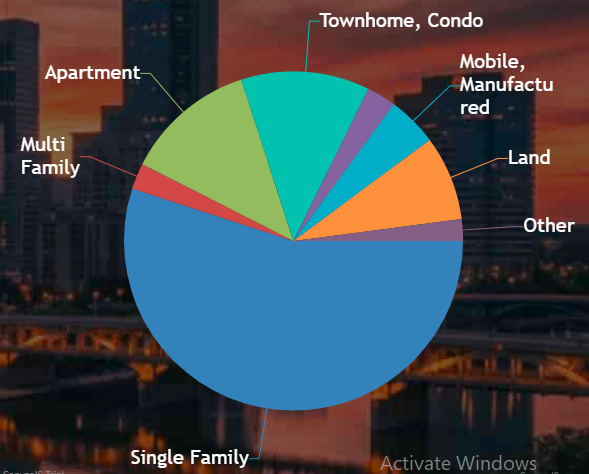
Ohio Property market chart

Ohio’s population in early 2026 stands between 11.8 and 11.9 million, making it the 7th-largest state in the U.S. With 223,390 homes sold over the past year and a $254,000 median home price, Ohio continues to show a stable real estate market backed by strong buyer activity. The state currently reports 1,591 foreclosures and 121 REO properties, offering valuable insights for homeowners, investors, and property researchers.

Ohio is divided into 88 counties, each maintaining its own property records, parcel maps, tax assessments, and auditor databases. To make property search faster and more organized, we’ve grouped the entire state into five easy-to-navigate regions, helping you quickly access the exact property search and property record tools you need.

We Divide Ohio Into Five Regions for Easy Property Search

Central Ohio

17 counties

Northeast Ohio

21 counties

Northwest OH

17 counties

Southeast Ohio

18 counties

Southwest OH

15 counties

Central Ohio Counties

Central Ohio includes 17 diverse counties centered around Columbus. This region blends urban growth with rural communities, offering a balanced mix of residential, commercial, and agricultural property records for easy research. Choose your County Below and search property record by using our free online tool.

Southeast Ohio Counties

Southeast Ohio, part of Appalachian Ohio, features 18 counties known for their hills, forests, and historic towns. This region provides detailed property data across rural landscapes and growing small communities. For searching property record in this region click on your target county.

Northeast Ohio Counties

Northeast Ohio is one of the state’s largest regions, home to major cities like Cleveland, Akron, and Canton. With 21 counties, it offers extensive residential, industrial, and lakefront property data. search any county record in Northeast Ohio.

Northwest Ohio Counties

Northwest Ohio includes 17 counties stretching toward Lake Erie and covering major hubs like Toledo. This region offers a wide range of rural, suburban, and agricultural property records for users to explore. Search your property record in this region.

Southwest Ohio Counties

Southwest Ohio includes 15 counties anchored by Cincinnati and Dayton. This region features strong real estate markets, busy suburbs, and a variety of property records for residential and commercial needs. Check any property record in southwest ohio.

Ohio Real Estate Market Overview

Total Residential Properties: 4,242,400

Total Commercial Properties: 378,224

Avg. Home Age (Single-Family Home): 58 years

Avg. Square Feet (Single-Family ): 1,705 sq. ft.

Total 2025 Residential Sales: 199,404

% of Homes Seriously Underwater (Q4 2025): 1.37%

Total 2024 Residential Sales: 200,156

% of Equity-Rich Homes (Q4 2025): 36.11%

Effective 2024 Property Tax: 1.28%

Total Foreclosure Filings (Year-to-Date): 14,637

Ohio Housing Market Key Metrics - Last 5 Year Data

Access complete Ohio real estate data for the last five years, including monthly trends in down payments, homes sold, loans, foreclosures, and REO properties. Users can easily download this comprehensive dataset in PDF or image formats, making it perfect for analysis, investment decisions, or market research.

Median Sales Price 2021 to 2026

From January 2021 to January 2026, Ohio’s median home listing prices steadily increased, reflecting a strong real estate market. Prices rose from $184,500 to $270,000, highlighting growing demand across the state. For buyers and investors, Ohio property search insights reveal trends, helping make informed decisions on homes and investments.

Median Down Payment 2021 to 2026

From January 2021 to January 2026, Ohio’s median down payment steadily increased from $12,400 to $31,500, reflecting rising home prices and buyer investment trends. This insight is essential for Ohio property search enthusiasts, helping first-time buyers and investors understand affordability patterns and plan financially for successful home purchases statewide.

Number of Homes Sold in 2021 to 2026

From January 2021 to January 2026, Ohio’s monthly home sales fluctuated between 6,854 and 17,210, reflecting shifting buyer demand and seasonal trends. Tracking homes sold helps Ohio property search users understand market activity, plan strategic purchases, and identify peak buying periods for informed investment and real estate decisions statewide.

Number of Purchase Loans in 2021 to 2026

From January 2021 to January 2026, Ohio’s monthly purchase loans ranged from 5,483 to 13,768, reflecting strong buyer activity and financing trends. Tracking purchase loans helps Ohio property search users gauge market momentum, plan mortgage strategies, and make informed decisions when buying homes, ensuring smarter investments across the state’s housing market.

Number of REFI Loans 2025

From January 2021 to January 2026, Ohio’s monthly refinance (REFI) loans declined from 22,450 to 3,950, reflecting shifting interest rates and homeowner refinancing trends. Tracking REFI activity helps Ohio property search users understand mortgage refinancing opportunities, optimize financial decisions, and gauge market conditions for smarter home loan strategies statewide.

Number of HELOC Loans 2021 to 2026

From January 2021 to January 2026, Ohio’s monthly HELOC loans steadily increased from 3,120 to 5,140, reflecting growing homeowner equity and borrowing trends. Tracking HELOC activity helps Ohio property search users understand home financing options, plan strategic investments, and leverage equity for renovations, consolidations, or other financial opportunities statewide.

Total Foreclosure Filings 2021 to 2026

From January 2021 to January 2026, Ohio’s monthly foreclosure filings ranged from 380 to 1,842, reflecting market stress and economic shifts. Monitoring foreclosure trends helps Ohio property search users identify potential opportunities, assess neighborhood stability, and make informed buying or investment decisions while staying updated on changing housing market conditions statewide.

Foreclosure Starts 2021 to 2026

From January 2021 to January 2026, Ohio’s monthly Trustee/Sheriff sales ranged from 225 to 1,510, reflecting foreclosure resolutions and property auction trends. Tracking these sales helps Ohio property search users identify investment opportunities, understand market dynamics, and make informed decisions about buying foreclosed properties and assessing neighborhood stability across the state.

Completed Foreclosures (REOs) 2021 to 2026

From January 2021 to January 2026, Ohio’s completed foreclosures (REOs) ranged from 75 to 398 per month. Tracking REO trends helps property investors, buyers, and real estate professionals identify market opportunities, assess neighborhood stability, and make informed decisions about acquiring bank-owned or previously foreclosed properties across the state.

Frequently Asked Questions (FAQs)

How can I search for property records in Ohio using this website?

Our platform provides a fast and easy Ohio property record search. Simply enter the property address, owner name, or Parcel ID (APN) in the search bar to instantly access detailed Ohio property records, including ownership, tax, and valuation data across all counties.

Yes! You can search, view, and analyze Ohio property records for free. Our website provides transparent access to official county data, including owner details, sales history, and property valuations, without any subscription or payment required.

Each Ohio property record includes comprehensive data: current owner, appraised value, land vs. building valuation, legal description, acreage, and recent tax assessments. This makes it easy to research properties for investment, buying, or local market analysis.

We update our database regularly with official Ohio county records to ensure accurate and current property information. From recent sales to updated valuations, users can rely on our platform for the latest Ohio property data.

Yes! You can search by street address, owner name, or Parcel ID to quickly locate the unique APN for any Ohio property. Our system automatically identifies and displays the correct Parcel ID for easier property research.

Absolutely. Each record includes Ohio property sales history, showing previous sale dates and prices. This helps buyers, investors, and researchers track property value trends over time across different counties and neighborhoods.

Our interactive Ohio real estate market charts let you explore trends by sales volume and median prices. Toggle between “Sales Trends” and “Price Trends” to analyze how property values fluctuate across Ohio counties and cities.

Yes, our tool covers all 88 Ohio counties. Use “Browse by County” or “Explore by City” to access detailed Ohio property records anywhere in the state, from urban centers like Cleveland and Columbus to smaller rural areas.

Scroll to Top